We work with a variety of healthcare clients who use a plethora of advanced tools to collect big data. Often times the goal is to get advanced analytics on their various digital platforms and campaigns. Hootsuite, Sprinkler, Google Campaign Manager, and of course, the big one: Google Analytics.
No tool is quite so ubiquitous, powerful, or anywhere near as intimidating as Google Analytics. But many users struggle to get as much out of this tool as it offers. In this article, we’ll share a few examples of how your healthcare organization can quickly get powerful insights out of Google Analytics.
Google Analytics is free and easy to install via a Content Management System interface. The tool collects so much out of the box and therefore you’ll begin collecting helpful data off from the start.
So it’s just easy and low-risk enough that often the marketing department sets up a Google Analytics account. And the installer then becomes the resident “Google Analytics expert”. This is, usually, not a position they have signed up for. However, while the initial setup and installation of this tool are low in difficulty, the learning curve is high
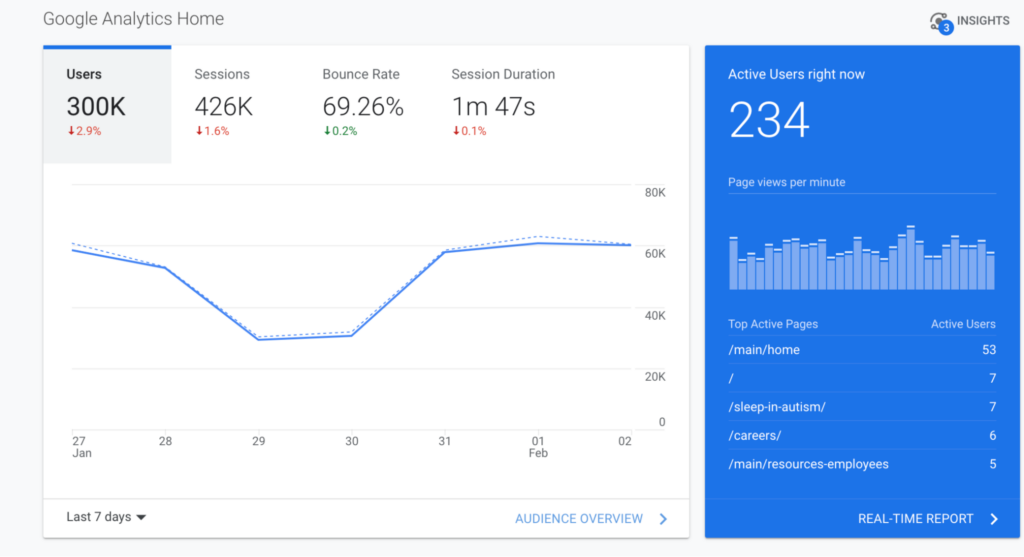
The initial dashboard you’re presented with is easy to navigate.
But doing anything deeper and clicking around, let’s say for a custom report is anything but clear.
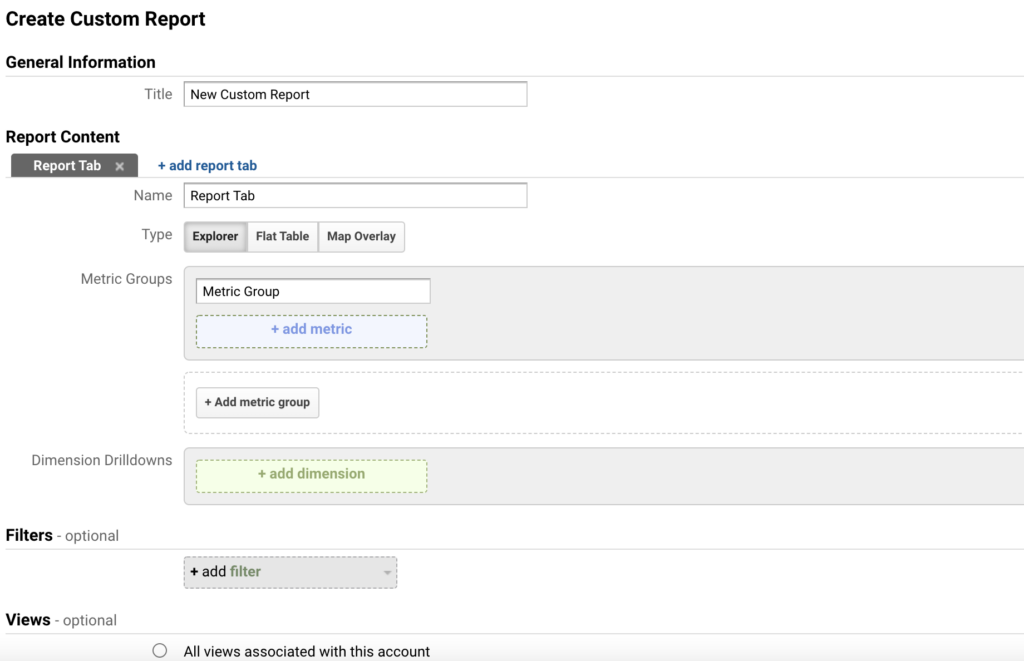
This can feel very complicated. The data itself isn’t always the most welcoming. For example, check out this report in Google Analytics.
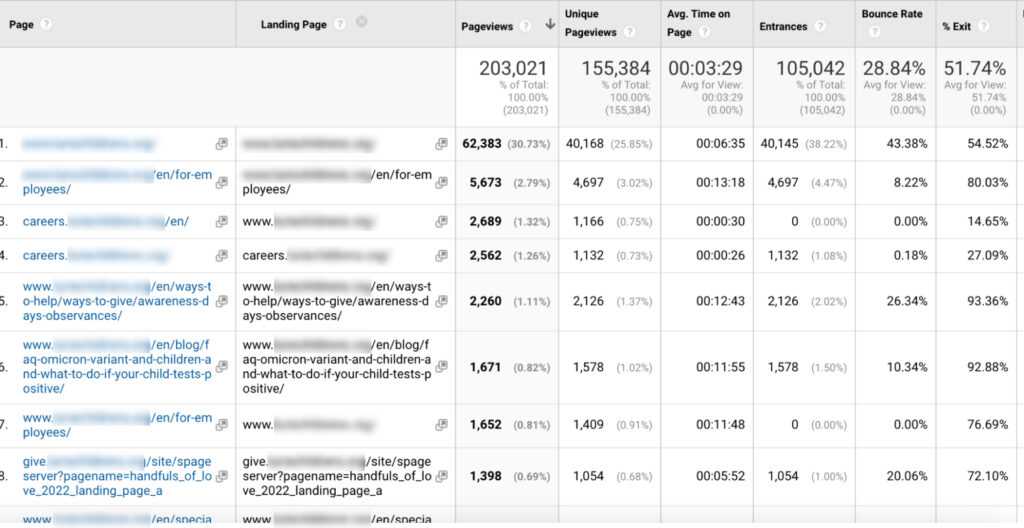
What do all these fields mean? How do I tell the difference between a page and a landing page? What about bounce rate and exit %? Are any of these metrics good or bad?
Google Analytics does not offer us context for any of these metrics and is therefore very difficult to interpret.
We often see healthcare teams start with the reporting infrastructure but get lost, or worse, overwhelmed, and simply stop.
Google Analytics is incredibly powerful and easy to set up but is hard to utilize without proper context. In practical terms, many hospitals have Google Analytics but can only get a fraction of the insight that they should be able to get from it.
So, here are a few real-world examples of how to get this UX information and how to use it.
There are a wealth of ways you can cut and slice this data. If you’re overwhelmed, I have good news for you: there are a bunch of very simple ways to access and view this data without a ton of effort. Small wins can make the tool less overwhelming!
Below are three common scenarios that will be meaningful to a healthcare system like yours. In addition to quick-and-dirty data, you can pull to have a meaningful, data-informed conversation.
There’s a consistent theme that we run into when designing a website: somebody important (usually a VP or equivalent) comes to a meeting with an idea-request-demand.
“Hey, we just got a big grant for our excellent cardiology research,” they say. “We should promote this and make cardiology more prominent on our website’s homepage!”
Now, your initial thought may be “Okay how can we add this feature or content? But I don’t want to disrupt the homepage”. Or even “No, we can’t just redesign the homepage to account for your whims.”
But there’s a deeper issue we need to unpack first.
The assumption is that the homepage is the place where most people will see that information is not accurate.
Here’s what I mean. Go to your Google Analytics account right now and see how many people ENTER the site on the homepage. You can do in Universal Analytics via this report:
And the report you’ll look at will look something like this:
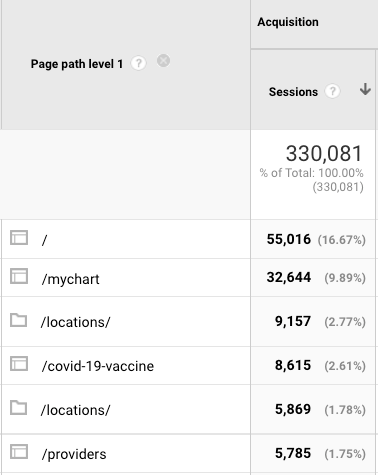
What do we see here? First of all, yes, there are a ton of entrances on the homepage. If we look at the helpful percentage beside the homepage indicator, we can see that it’s still less than a quarter of the total entrances.
Keep that in mind: roughly 8 out of 10 people enter healthcare sites on a page other than the homepage.
We find this is broadly true across basically every client we work with in the healthcare space. Most consumers enter the site on a ‘detail’ page (provider, location, or service-line specific pages on your website).
Why does this matter for your conversation with your C-Suite person? How could or should we better use our data?
Well, people often think of homepages as the front doors of the website, however, that’s wrong.
Google is the “front door” of your website, and it dumps users into the interior of your site with regularity. These detail pages like “www.hospital.com/doctors/your-doctor-name-md” or “www.hospital.com/service-line/cardiology.”
Healthcare websites often have simple, easy-to-filter URL strings that can be used to parse out content types like “locations/” or “/providers/”. A filter for those strings can give you a long, inclusive list of these granular types of content pages. This will allow you to see a clearer picture of exactly where people are arriving on your website.
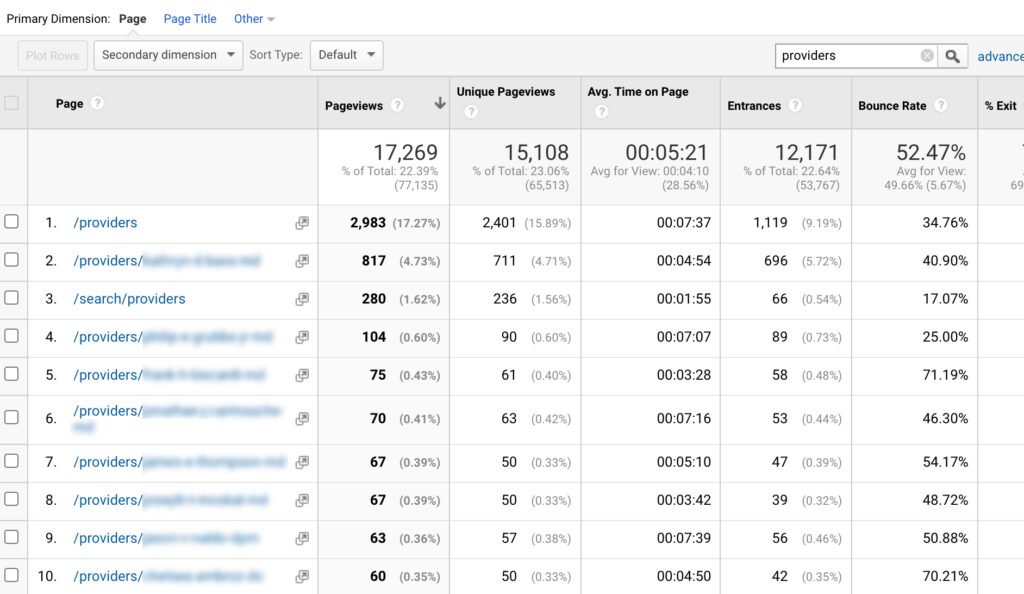
Even with these simple queries, we’ve shifted the conversation to a more interesting place: 12,000 visits began on provider detail pages! If we really want to increase the visibility of our cardiology research then we should increase visibility on the provider pages.
And while we’re at it, how can we increase the connective tissue on those provider, location, and service-line pages so that people can more easily navigate the site?
Looking at entrances and specific groups of URLs, can often be an easy way to figure out the real “front doors”. If it’s not what you expect, that can be a helpful way to redirect either strategy (how do we adjust to this new reality?) or spending (should we invest in better SEO performance for these areas that are underperforming?).
We suggest that rather than add a feature to the homepage highlighting cardiology, we could instead add some content to both highlight the awesome research and make those provider profiles or location pages even better and more appealing.
Here’s another common example:
Southeastern Hospital put a bunch of time, money, and effort into building out online scheduling tools to allow its users to digitally book appointments. That’s great! But so far, it seems like the result is a paltry trickle of actual people coming in for appointments.
The first thing we should recognize is that the big call-to-action button on our website that allows users to “schedule an appointment online” is not the end of the user journey. Rather it’s just one step along the way from “deciding I need care” to “physically present in a doctor’s office“.
Here’s how we often think about our digital tools:
User visits site –> user clicks on CTA = Conversion!
And that is, unfortunately, an oversimplification.
An actual user flow will look something more like this:
It’s a much more complicated and multistep process. At every step, a user can abandon the process. Often, a surface-level look will simply tell us the end result of our user journey. Rather we need to focus the whittling down what occurs throughout the process.
In this equation, where is the dropoff? Where is the pain point? Is it the design and placement of the button? Or is it in the form that individuals are required to fill out online?
This is an important UX feature.
An easy way to find this in Google Analytics is the creative use of custom segments. When logged in to Google Analytics, pull up the segment builder to create a new segment:
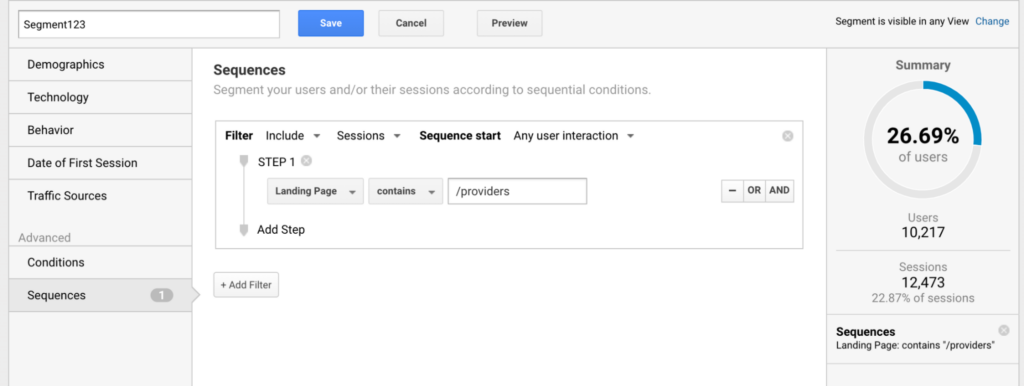
If you hit the ‘preview’ button, you can see exactly what percentage of users accomplished this task. When you update that segment with a subsequent step, you can see the preview changes;
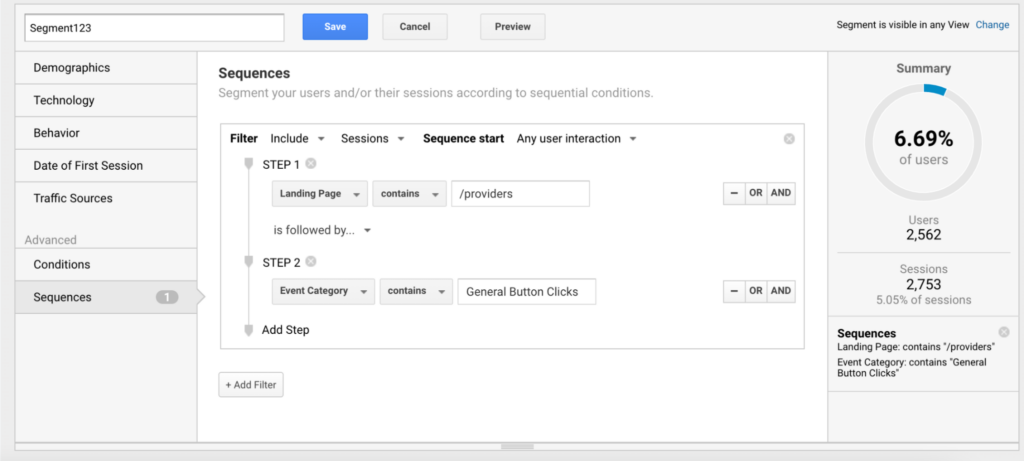
That’s a quick-and-dirty way to get some identification as to where there’s a bigger-than-expected dropoff in sessions or users, and use that to direct your efforts. You still have to be able to accurately identify the steps and for this, you’re going to want to use either events + pageviews if you have them, or URL string fragments if you don’t.
Think through what we can do better about that particular stage in the journey? Can…
And, if this step is difficult, is it even necessary?
This is another common issue we run into with our hospital clients: somebody comes storming in and says…
“Our internal site search stinks! I’ve been searching my name/specialty/location and no relevant results pop up! We’ve got to reassess how our search results are ranked, it’s all wrong.”
Before we fully revamp our search weighting, let’s figure out a quick way to use Google Analytics to get an answer to that question.
The first thing you should ask in this situation is not “is our internal search successful?” but rather, “what do we mean by “successful?’’
Maybe this is “select a relevant search result from the list displayed.” Maybe you want this to be “clicks on a specific CTA” after that search result. Maybe you want them to end up in a specific location or URL on the website.
Most of the time, the simplest way to ascertain “success” for an internal search tool is “did the user find a relevant search result?” The good news is that there is a straightforward way of getting that information.
Almost all the time, your search information will be pushed into the URL in the form of parameters. They’ll look something like this, and populate when a user executes a search:

This process makes it easy to trace a user through the search journey. It also is why we like using URL parameters rather than or in addition to Google Analytics’s native site search features: this allows us to get information on the filters used as well as the queries used, and most healthcare providers have internal find-a-doc or find-a-location tools that feature filters very heavily.
So what do we do here? We look for the search pages with a query parameter attached. The easiest way to do this is by content categorization. We’re looking for two specific steps here:
In order to do this, we need to run a very simple report: We need to go to the all pages report, located here in the GA interface:
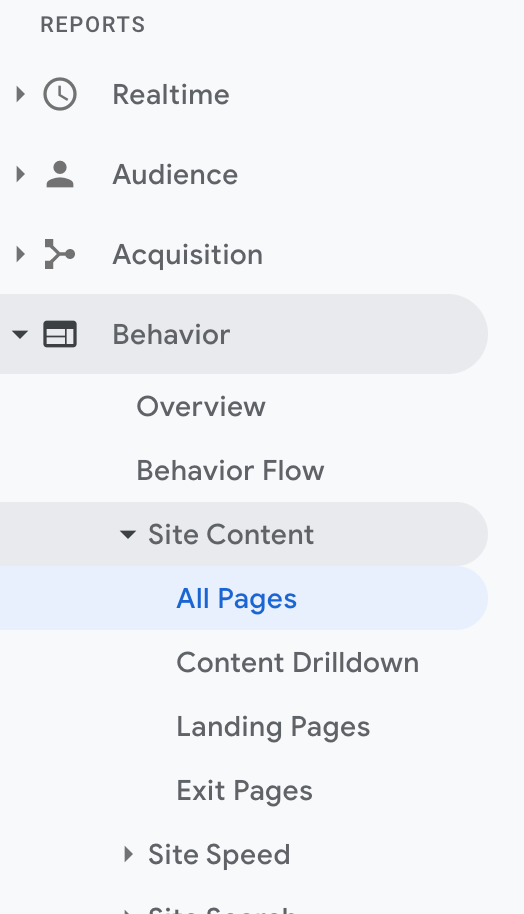
Once there, we are going to add a secondary dimension called “Previous Page Path” to the report.
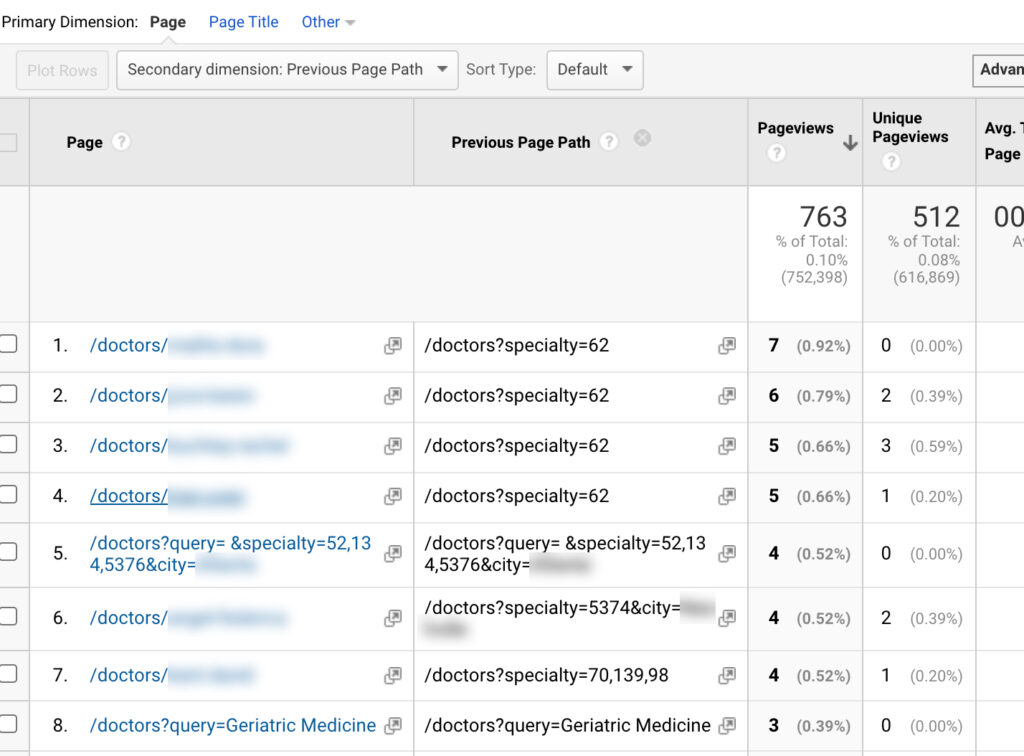
The last piece of this puzzle is to add a custom filter to this report, where we filter the previous page path to only include urls that include an entered query (that’s the “?” piece of this puzzle. And yes, I have chosen an example that is particularly clear-cut, if you want to choose a messy example well then you should use that in the blog you write). We also filter the page paths to include only those pages with a provider profile page as the next page.
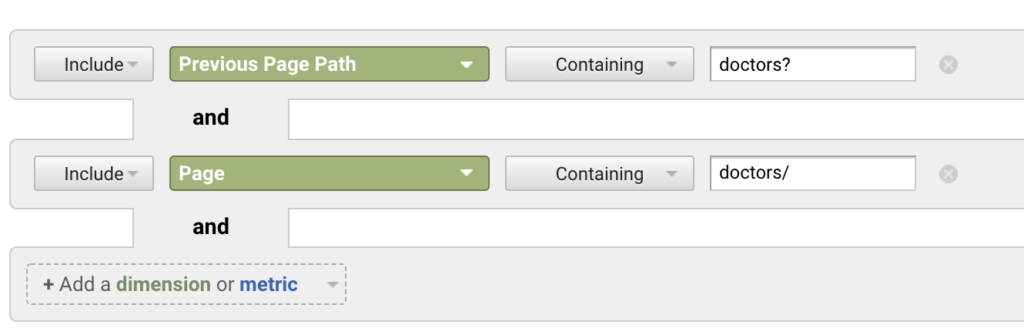
So what we have here, then, is a helpful little dataset: we know what queries are entered, as well as what pages they subsequently ended up on.
You can adjust the filter that you use to be more or less specific or more inclusive and see what specific filters or queries led to, or what specific results were clicked on. You could even use either the Google Sheets integration via API or an API call from R or Python and get even more detail there as well, but even without that, these steps would give you a pretty good first look at the data and let you feel more confident and familiar with moving forward!
I hope this has provided you with some helpful first steps towards actually getting MORE out of your Google Analytics implementation in a real, practical, tactical sense. These are all really common, simple versions of analyses and data diving that we do for our clients regularly.
However, I also want to make a note here: each of these scenarios involves some strategic thinking as a preamble to their execution.
We have to redirect from a poorly formed directive to a better research direction and question.
First, we have to better identify and layout our user funnel and identify the steps involved.
We have to identify and align on how we’re defining “success.” That part of the puzzle is, of course, every bit as important as the analysis itself (I argue it’s more important, but this is a blog post trying to give you tactical stuff to do and get some cool use out of a tool you probably already have!).
We hope these tactics can be used to get some real use out of your free tools! Good luck, and don’t be afraid to break things.
 Powell Latimer
Analytics Manager
The original version of this page was published at: https://www.modea.com/news/google-analytics-for-healthcare-3-helpful-ux-reports/
We help healthcare organizations identify the right digital strategies and create products that infuse control, transparency, and choice into the consumer healthcare experience.
Connect Patients to Care Faster With HIPAA-Compliant Maps
A Feature Rich Alternative to Google Maps